Breast screening is rapidly moving into an era of personalized care, where prevention, early detection, and treatment are guided by risk assessment. Currently, the most comprehensive breast cancer risk assessment model available is the Tyrer-Cuzick risk model version 8 (TCv8).1 It is recognized globally as a valuable tool for determining appropriate pathways for therapeutic intervention and/or supplementary screening.2, 3, 4 However, there is little information about how to use TCv8 clinically to obtain the most accurate lifetime risk estimates.
This blog discusses three key best practices for using TCv8 clinically. To learn more, download our 5-Step Guide for Best Practices.
Step 1: Include breast density as a risk factor
There is overwhelming evidence that breast density is an independent risk factor for the development of breast cancer.5, 6 In May of this year, the first validation paper was published showing the value breast density added to the Tyrer-Cuzick risk model.7 The results found that inclusion of breast density, with other classical risk factors, increased the number of women accurately identified at higher and lower risk of breast cancer.
Two clinically practical breast density measurements validated for use in TCv8 are:
1) % Volpara Volumetric Density (VBD%)
The validated density input for the use of VBD% is the average of the left and right breast VBD% as measured by VolparaDensity.
2) BI-RADS® ATLAS Density
The validated density input for the use of BI-RADS ATLAS Density is the visual assessment using BI-RADS 4th edition guidelines (1/2/3/4). The assessment should then be mapped to the BI-RADS 5th edition equivalent (1→ a. → b, → c, 4→ d) before entering the density grade into the model.
Using a validated measure of breast density adds significant value to the TCv8 risk assessment model.
Step 2: Understand how the different breast density measurements impact risk scores
There are key differences in the two methods of breast density measurement validated for use in Tyrer-Cuzick risk model:
| Automated Average VBD% |
Visual ACR BI-RADS 4th Edition |
| Provides a precise measurement of density, on a continuous spectrum, that generates a risk score specific to an individual’s unique density measurement. | Provides a 4-step measurement of density that may result in an under- or overestimation of an individual’s breast density risk. |
| Is an objective, reproducible measurement of density that has excellent agreement with MRI.8 | Is a subjective visual measurement that is dependent on radiologist experience for accuracy.9 |
Example:
Three women walk into a breast screening clinic with exactly the same risk factors and a visual breast density of BI-RADS 3, which we would enter as “C”. What happens when their unique volumetric breast density % (VBD%) is entered into TCv8 as opposed to the BI-RADs score?
Risk factors
Age: 55y
Height: 5’4″
Weight: 130 lbs.
Children: No
Menopause: 52y
Mother BC: 60y
VBD% = 8.2
VBD% = 10
VBD% = 13.9
| Density Method | Density Score | Lifetime Risk |
| BI-RADS | C | 17.1% |
| VBD% | Low C (8.2%) | 15.9% |
| VBD% | Middle C (10%) | 18.6% |
| VBD% | High C (13.9%) | 23.8%* |
* >20% lifetime risk indicates that this woman may benefit from additional supplemental screening.10
Volumetric breast density can give a more accurate reflection of risk because of the continuous nature of both the risk model and density calculation.
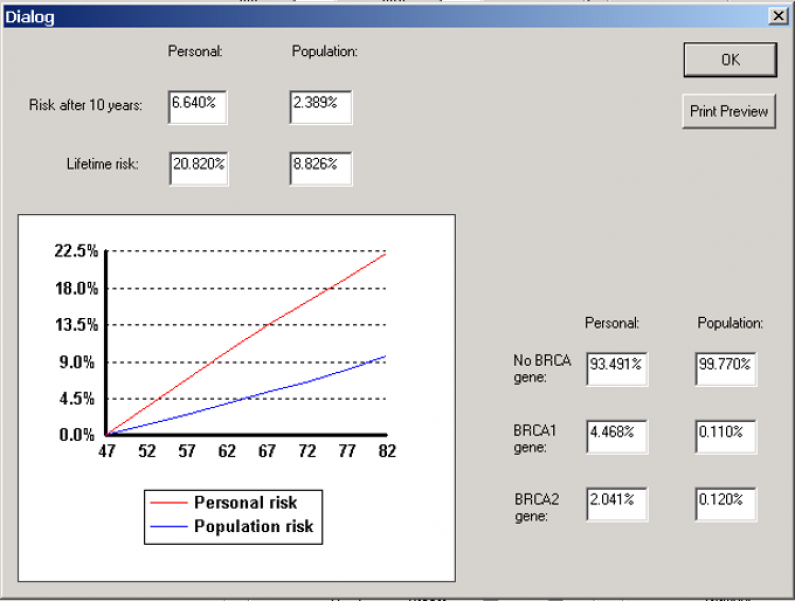
Step 3: Ensure competing mortality is turned ON—especially if calculating lifetime risk scores
A breast cancer risk assessment provides a realistic estimate of a woman’s risk of developing breast cancer over a period of time. However, there is also a risk that a woman may die from other competing causes of mortality before breast cancer can manifest—this is absolute risk.5 If competing mortality is not included in the risk calculation, a woman’s lifetime risk score may be inflated and less representative of her actual risk.11, 12
Example:
Risk factors
Age: 47y
Height: 5’4″
Weight: 130 lbs.
GMother BC: 68y
| Breast Density | Lifetime Risk Competing Mortality OFF ☐ | Lifetime Risk Competing Mortality ON ☑ |
| Visual BI-RADS: D | 21.8% | 18.4% |
| VBD: 15.6% (average) | 21.5% | 17.9%
↑ Realistic Lifetime Risk! |
Note that competing mortality is not turned on by default in the Tyrer-Cuzick risk assessment model.13
Confirm that competing mortality is turned ON to avoid erroneous inflation of your patient risk scores.
Download our full 5-Step Guide for Best Practices for two more considerations for your practice.
OR
To learn even more, view our complimentary on-demand webinar, “Best Practices for Implementing Tyrer-Cuzick v8 in Breast Cancer Screening” on YouTube . It covers these topics:
- Risk-calculation differences based on best-practice implementation
- Important factors in risk calculation
- Key considerations for your practice
1. Terry, M.B. et al. 10-year performance of four models of breast cancer risk: a validation study. Lancet Oncol 20, 504–517 (2019).
2. The American Society of Breast Surgeons. Position Statement on Screening Mammography. 2019.
3. Radiology, A.C.o. ACR Position Statement 2012 [cited]Available from: http://www.acr.org/About-Us/Media-Center/Position-Statements/Position-Statements-Folder/Statement-on-Reporting-Breast-Density-in-Mammography-Reports-and-Patient-Summaries
4. National Comprehensive Cancer Network. NCCN Clinical Practice Guidelines in Oncology Breast Cancer Screening and Diagnosis. 2019.
5. Boyd, N.F. et al. Breast tissue composition and susceptibility to breast cancer. J Natl Cancer Inst 102, 1224–1237 (2010).
6. Assi, V., Warwick, J., Cuzick, J. & Duffy, S.W. Clinical and epidemiological issues in mammographic density. Nature reviews. Clinical oncology 9, 33–40 (2012).
7. Brentnall, A.R. et al. A Case-Control Study to Add Volumetric or Clinical Mammographic Density into the Tyrer-Cuzick Breast Cancer Risk Model. Journal of Breast Imaging (2019).
8. Sartor, H. et al. Measuring mammographic density: comparing a fully automated volumetric assessment versus European radiologists’ qualitative classification. Eur Radiol 26, 4354–4360 (2016).
9. Eom, H.-J. et al. Comparison of variability in breast density assessment by BI-RADS category according to the level of experience. Acta Radiologica 59, 527–532 (2018).
10. Mainiero, M.B. et al. ACR Appropriateness Criteria((R)) Breast Cancer Screening. J Am Coll Radiol 14, S383-s390 (2017).
11. Gail, M.H. Twenty-five Years of Breast Cancer Risk Models and Their Applications. JNCI: Journal of the National Cancer Institute 107 (2015).
12. Himes, D.O., Root, A.E., Gammon, A. & Luthy, K.E. Breast Cancer Risk Assessment: Calculating Lifetime Risk Using the Tyrer-Cuzick Model. The Journal for Nurse Practitioners 12, 581–592 (2016).
13. Cuzick, J. IBIS Breast Cancer Risk Evaluation Tool. 2017 [cited 2019 November 12]Available from: http://www.ems-trials.org/riskevaluator/