
While mammography is the global standard for breast screening, the systems used to evaluate the quality of an image have traditionally varied between countries and regions. Optimal positioning of the patient’s breast is crucial for ensuring the maximum possible amount of breast tissue has been imaged in the clearest manner. There is potential for cancer to go undetected if any tissue is excluded or obscured. Deficient positioning has been found to account for most American College of Radiology (ACR) accreditation failures1 and is a significant cause of technical recalls and yet there is no unanimous method of image evaluation in the United States.2,3 The subjectivity of image evaluation and potential for bias can cause dissatisfaction of the technologist involved, and ultimately, higher anxiety, discomfort, and dosage exposure to the patient.
A systematic approach to evaluate mammography positioning in the world was developed in the UK in 1994, and is now widely used across the UK, Australia, and New Zealand. The United Kingdom Mammography Trainers Group, with the support of the Royal College of Radiographers, developed the PGMI Image Evaluation System as a method of external audit to ensure a high standard of mammography. The assignment of the PGMI (Perfect, Good, Moderate, Inadequate) score is dependent on the image meeting certain, visually assessable criteria. The primary goal of the image is visibility of all breast tissue, including the inframammary fold, nipple in profile, and pectoral muscle. While the PGMI system is hugely beneficial in that it sorts images by quality and compares performance trends, the practice of visually assessing and categorizing images remains highly subjective.
Just as studies have shown the inconsistent way in which radiologists visually assess breast density using the BI-RADS density classifications4,5, Boyce, et al. demonstrated the inter-observer variability of the PGMI criteria evaluation, or the variability between different radiologists.6 A more recent study from Taylor, et al. found that inter-observer agreement was somewhat limited, even when an expert panel first came to a consensus on the criteria and specific wording for the image quality criteria.7 Taylor also emphasizes that the study minimized intra-observer variability by having large numbers of images analyzed, however technologists quickly assessing mammography quality immediately after taking an image do not have that same benefit.7 This means that should a technologist review the same image multiple times, they would expect some disagreement with each review—something which has also been demonstrated in radiologists’ visual assessment of breast density.4,5
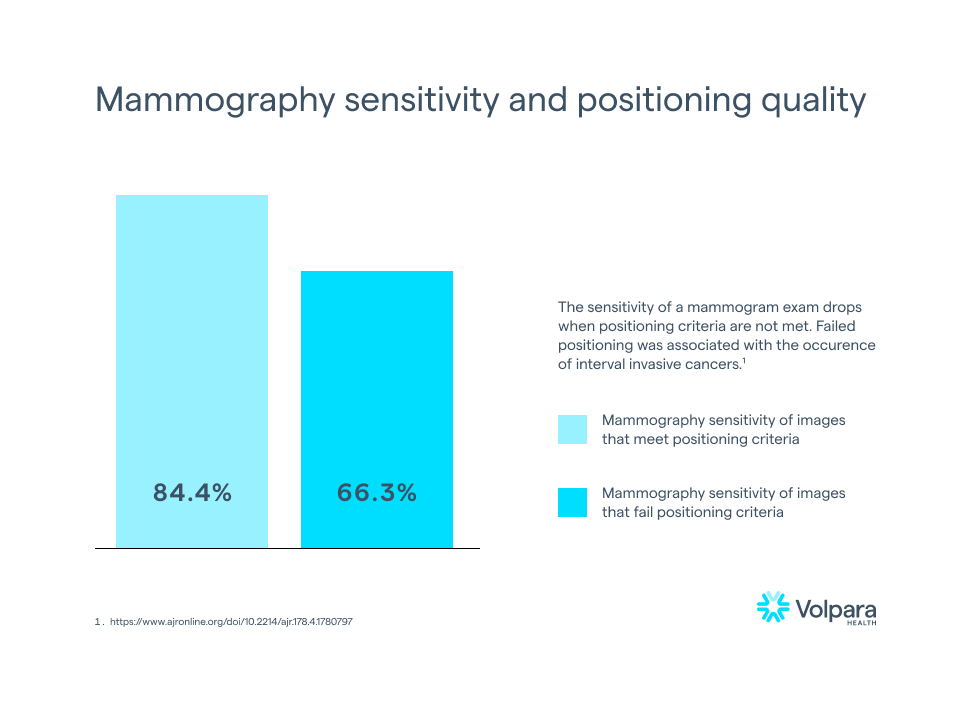
While this may not be unexpected, it is certainly not ideal. According to Taplin, et al., mammography sensitivity fell from 84.4% to 66.3% when image positioning quality dropped from meeting positioning criteria (e.g., receiving a Perfect, Good, or Moderate score) to failing to meet the positioning criteria (e.g., receiving a score of Inadequate).8 Furthermore, invasive interval cancers were more likely after images failed positioning5, meaning that there is clinical evidence that failing a positioning metric could mean missing a cancer in a mammogram.
This is strong evidence for the need for automation of PGMI scoring. In theory, an objective, automated version of PGMI would reduce observer variability, provide technologists with critical performance feedback, reduce technical recalls, improve clinical performance, and remove bias from quality scoring. Volpara first introduced an automated image evaluation system in 2015. This system is used in both Volpara AnalyticsTM, for retrospective analysis of image quality by technologists and lead technologists, and the Volpara LiveTM product which can provide feedback in the imaging room for on-the-job training.
To make positioning evaluation objective, Volpara had to ensure the PGMI metrics were quantifiable. With the PGMI evaluation system being designed for visual assessment, some metrics such as “sufficient pectoral muscle” are not clearly defined, while others, such as “posterior nipple line” are. Additionally, it was necessary to understand the relative weighting of each metric on the outcome of PGMI evaluation. The failure to adequately demonstrate some metrics (e.g., cut-off of the breast) is so detrimental to a high-quality mammogram, that an Inadequate score will be assigned, regardless of the demonstration of other metrics.
Because Volpara’s positioning evaluation is entirely automated, it is applicable to every mammogram. To date, it has been applied to close to 60 million mammography images from 40 countries, including North America, New Zealand, and Australia, and represents the largest known automated breast positioning assessment cohort.
Volpara is also excited to announce its newest mammography quality initiative: Analytics in ActionTM. This program is designed to help breast centers foster a culture of recognition, reward, and continuous performance improvement based on objective data from Volpara Analytics.
In summary, optimal breast positioning and the production of high-quality mammograms is of the utmost importance in early cancer detection. Volpara has demonstrated that artificial intelligence (AI) is hugely beneficial in accurate and objective assessment of mammography positioning, and in helping breast centers to provide mammograms of the highest quality to their patients.
Interested in learning more about PGMI image evaluation, read the whitepaper on Volpara’s automated image quality assessment.
References:
1. U.S. Food and Drug Administration (2017). Poor Positioning Responsible For Most Clinical Image Deficiencies, Failures. Retrieved March 28, 2022, from https://www.fda.gov/radiation-emitting-products/mqsa-insights/poor-positioning-responsible-most-clinical-image-deficiencies-failures.
2. Salkowski, L. R., Elezaby, M., Fowler, A.M., Burnside, E., Woods, R. W., Strigel, R. M. (2019). Comparison of screening full-field digital mammography and digital breast tomosynthesis technical recalls. Journal of Medical Imaging, 6(3), 1.
3. Miller, L. C. (2015). Repeats, Rejects and Recalls: How Many is Too Many? The Member Newsletter of the Society of Breast Imaging, 2015(2).
4. Eom, H-J., Cha, J. H., Kang, J-W., Choi, W. J., Kim, H. J., Go, E. (2018). Comparison of variability in breast density assessment by BI-RADS category according to the level of experience. Acta Radiologica, 59(5):527–532.
5. Sprague, B. L., et al. 2016. Variation in Mammographic Breast Density Assessments Among Radiologists in Clinical Practice. Annals of Internal Medicine 4;165(7):457–464.
6. Boyce, M., Gullien, R., Parashar, D., Taylor, K. (2015). Comparing the use and interpretation of PGMI scoring to assess the technical quality of screening mammograms in the UK and Norway. Radiography, 21(4):342–347.
7. Taylor, K., et al. (2017). Mammographic image quality in relation to positioning of the breast: A multicentre international evaluation of the assessment systems currently used, to provide an evidence base for establishing a standardised method of assessment. Radiography, 23(4):343–349.
8. Talpin, S. H., Rutter, C. M., Finder, C., Mandelson, M. T., Houn, F., White, E. (2002). Screening Mammography: Clinical Image Quality and the Risk of Interval Breast Cancer. American Journal of Roentgenology, 178(4):797-803.