
This blog series will delve into Volpara Health aggregated and de-identified user data to provide insights into breast screening trends, patterns, and interesting observations across the United States. Volpara Health software is used in over 35% of all US breast cancer screenings. We are intent on leveraging the data from those screenings to drive continual improvements to our products for our customers and the wider community to ensure the highest quality and most effective personalized breast health care.
Knowing more about your screening population is important as it is likely to impact aspects of clinical performance such as image quality, callback rate, supplemental screening rate, and missed cancers.
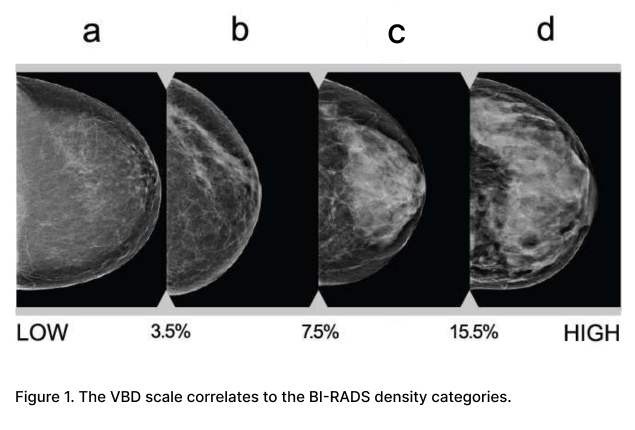
Our first insight shows that the prevalence of breast density characteristics varies widely across the US. Volumetric breast density (VBD) provides the exact volumetric measurement of dense tissue. The percentage value represents the ratio of fatty tissue to fibroglandular tissue based on the overall volume of the breast – see Figure 1.
The average VBD in parts of California is significantly higher than in the Midwest. Along the California coast specifically, breast volume is, on average, lower than the Midwest and in the range 700-1000cm3 and the average VBD is 8-10% which equates to a BI-RADS density category of “c,” whereas in the Midwest, breast volume is higher overall and in the range 1000-1300cm3 and the average VBD is 5-7%, equating to a lower BI-RADS density category of “b”. Figure 2 shows this variation by geography:
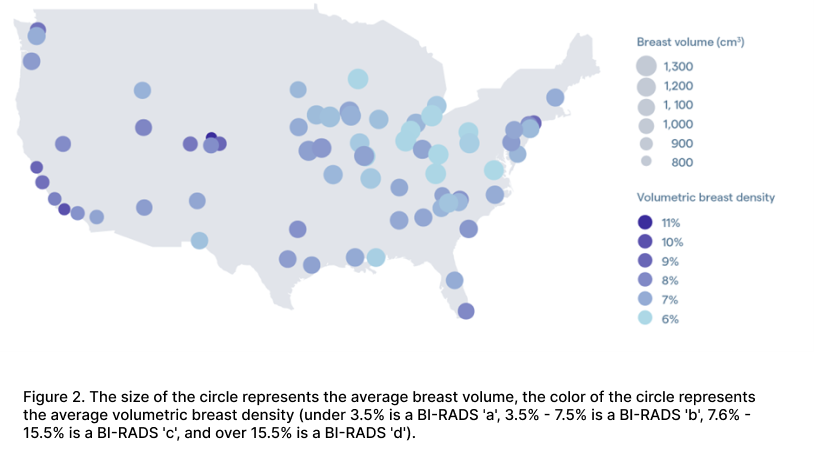
Several studies have shown how VBD is directly correlated to mammography sensitivity, with the paper by Destounis et al1 showing that sensitivity at a VBD of 9% is 83%, and at 6% it is 90%, so we should expect clinical performance to vary according to the population they serve. In this case, it’s likely that radiologists in California recall more women, and miss more cancers than those serving populations with lower average VBD. Similarly, when you look at metrics like the average number of images acquired per breast, you are likely to see more tiled images in the Midwest due to the large breast volume, so you should expect more images to be taken per breast.
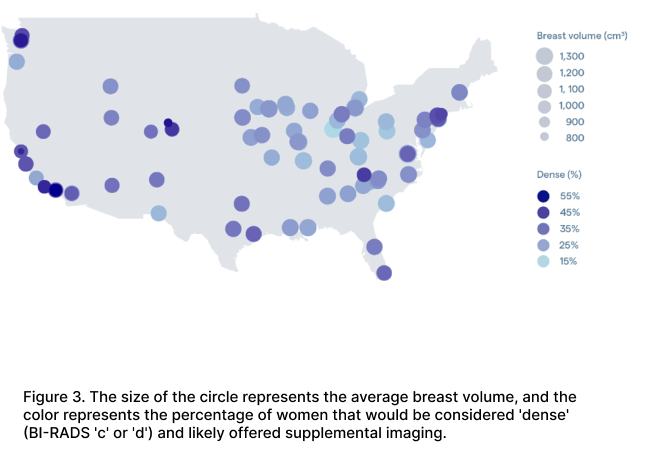
Looking at this data in a different way, Figure 3 shows the percentage of women at each region who would be classified as having dense breasts according to the BI-RADS breast density categories. You can see here that sites in California might offer ultrasound to 40-50% of their population due to the higher proportion of patients with high breast density, compared to those in the Midwest offering it to 15-25% of their population. These variations should be considered when deciding on resources, what machines to buy, and where to place them:
Using our de-identified image database, we have the potential to identify more trends and patterns like this across populations and geographical locations. Stay tuned to our blog series for our next insight, and please contact us at info@volparahealth.com with any feedback or suggestions and we’ll try to accommodate your requests in the next blog post.
References:
1. Destounis S, Johnston L, Highnam R, Arieno A, Morgan R, Chan A. Using Volumetric Breast Density to Quantify the Potential Masking Risk of Mammographic Density. AJR Am J Roentgenol. 2017 Jan;208(1):222-227. doi: 10.2214/AJR.16.16489. Epub 2016 Nov 8. PMID: 27824483.