Objective data can inform both quality and training direction for technologists
Eisenhower Schnitzer/Novack Breast Center is an American College of Radiology Breast Imaging Center of Excellence. We are the first facility in the Coachella Valley to earn this prestigious designation and we are committed to continuous quality improvement.
For two years, we have relied on Volpara®Enterprise™ software to track performance over time to ensure that our technologists are delivering the best patient experience and image quality possible. Last August we became an early adopter of a new special report—the Team Summary Report (now available to all users).
The report helps me save time with an efficient way of analyzing our team’s overall image quality as well as specific metrics such as positioning and compression performance.
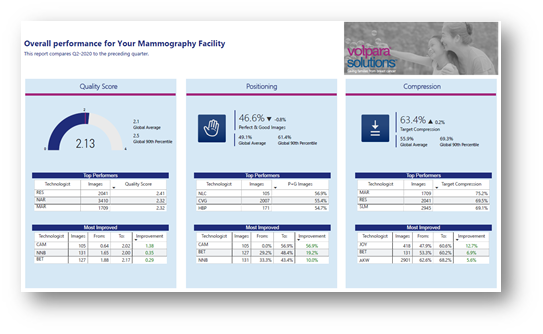
*Report images are sample only – not actual Eisenhower data
The measurable goals that we use are the quality score and the compression score. The 90th percentile is our target goal for the year.
I use the Top Performers and Most Improved lists to highlight those technologists’ improvements at our monthly department meeting.
It is wonderful to show to my team the strong techs in hopes that others want to be on the leaderboard.
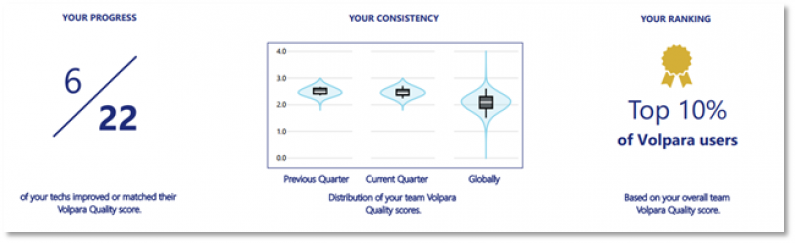
Easily seeing progress compared to other report periods is very helpful. As a team, we review the goal quarterly, but I also review the data with each technologist at our bimonthly one-on-one meeting. We develop an individual goal to work on at that time: What do they need to do as an individual or is there something we need to do as a department?
Those that have met the goal are recommended for a shining star, which is a reward system our organization has in place for those employees demonstrating actions that meet our six pillars.
The information provided is also exactly what I report to the leadership quality board and the Eisenhower Health Cancer Committee. I am able to show team and individual progress over time, our team quality consistency, and how we compare to other VolparaEnterprise users. The objective metrics, trackable progress, and comparison benchmarks are ideal for these discussions.
If you are new to the Team Summary Report, I recommend these strategies:
- Share all the data with your team. Let them see how they are doing as individuals and as a team.
- Get them involved in performance-improvement initiatives.
- Set goals for them to work on one area at a time.
- Celebrate those who have met a goal and/or have made the most improvement.
- Look for opportunities to share your progress more broadly in your health care system.